Q2 Banking Trends: Lower Net Income, Higher Loan Balances
Each quarter, the FDIC reports new information about the health of the American banking system in the Quarterly Banking Profile. This report contains key insights about the safety of banks, but it is vast and can be cumbersome to review.
Fortunately, we summarize the details that matter most to business and banking leaders following each release of data. Subscribe to our mailing list so you never miss an update and continue reading for the highlights from the second quarter.
Bank Net Income Declined in Q2
Net income for the banking industry as a whole declined by $677.2 million, or 1%, in the second quarter. This decrease broke the trend of rising net income that had persisted for the last three quarters, but the industry-wide number does not tell the whole story.
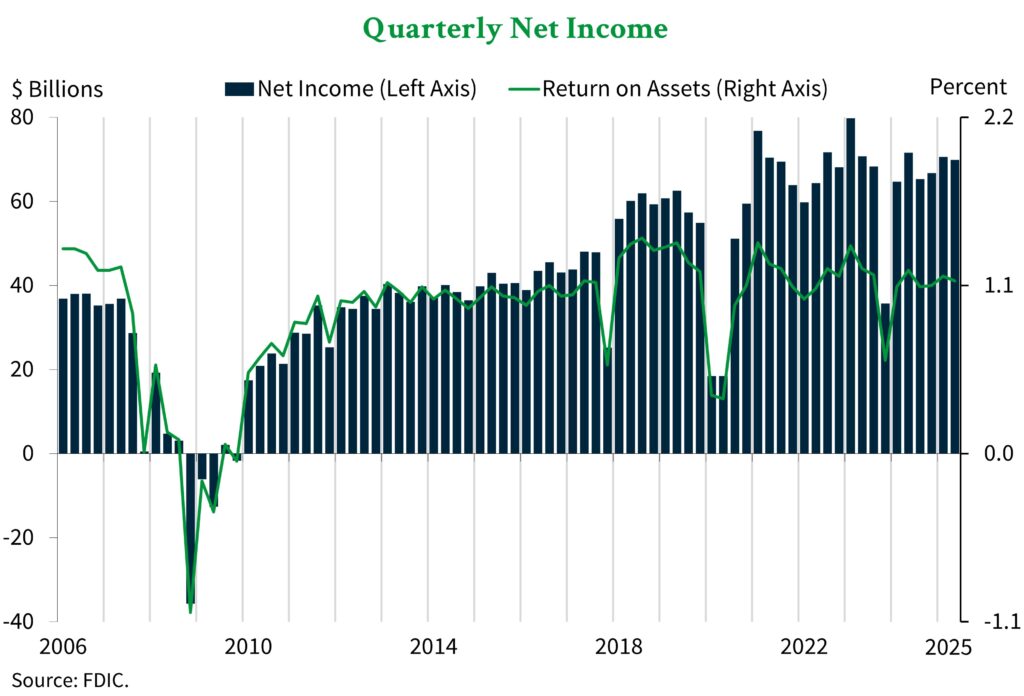
The quarterly change in net income was driven by a 33.7% increase in provision expenses stemming from an unspecified large bank acquisition. Without this large expense, net income would have increased for the quarter.
Total Bank Loan Balances Rose in Q2
Total banking industry loans rose by $263.7 billion, or 2.1%, in the second quarter. This growth was driven by increases in loans to non-depository financial institutions and loans to purchase or carry securities. Within these two types of loans, some of the increase was due to continued reclassifications to account for changes in how certain loan products are reported.
The chart below shows a significant increase compared to previous quarters. In fact, Q2 2025 marked the fastest pace of loan growth in the past three years.
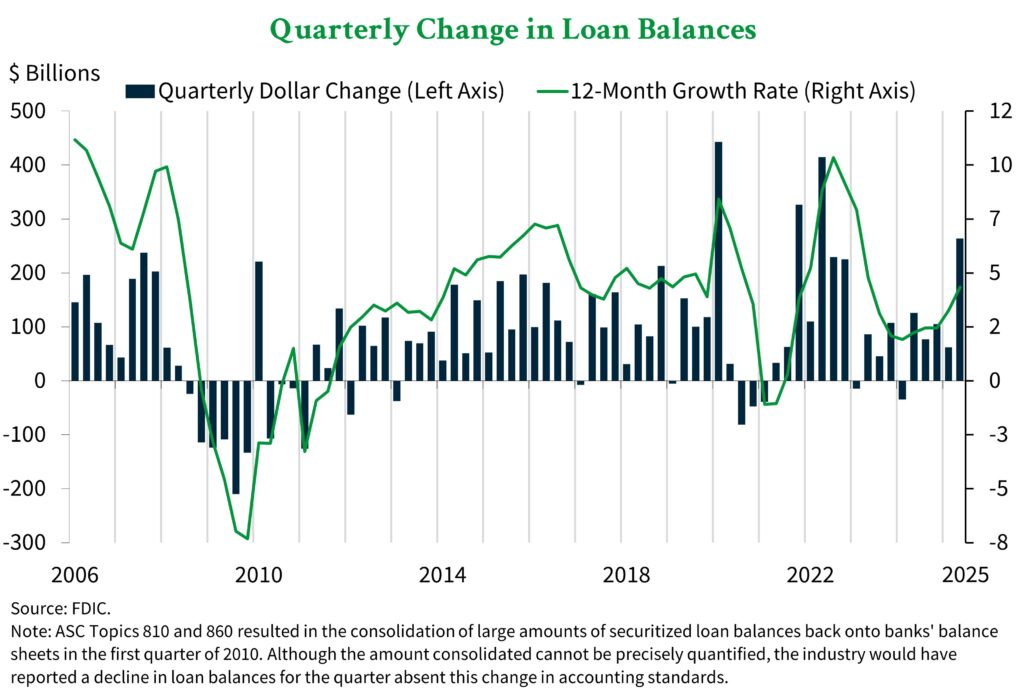
The annual loan growth rate rose from 3.0% in the first quarter to 4.0% in the second quarter. The improvement was notable, but this rate remains well below the pre-pandemic average of 4.9%.
Bank Asset Quality “Remained Generally Favorable” in Q2
The FDIC stated that “asset quality remained generally favorable” for banks in the second quarter. The data confirms this statement with declining past-due and nonaccrual [PDNA] and net charge-off ratios, as shown in the chart below.
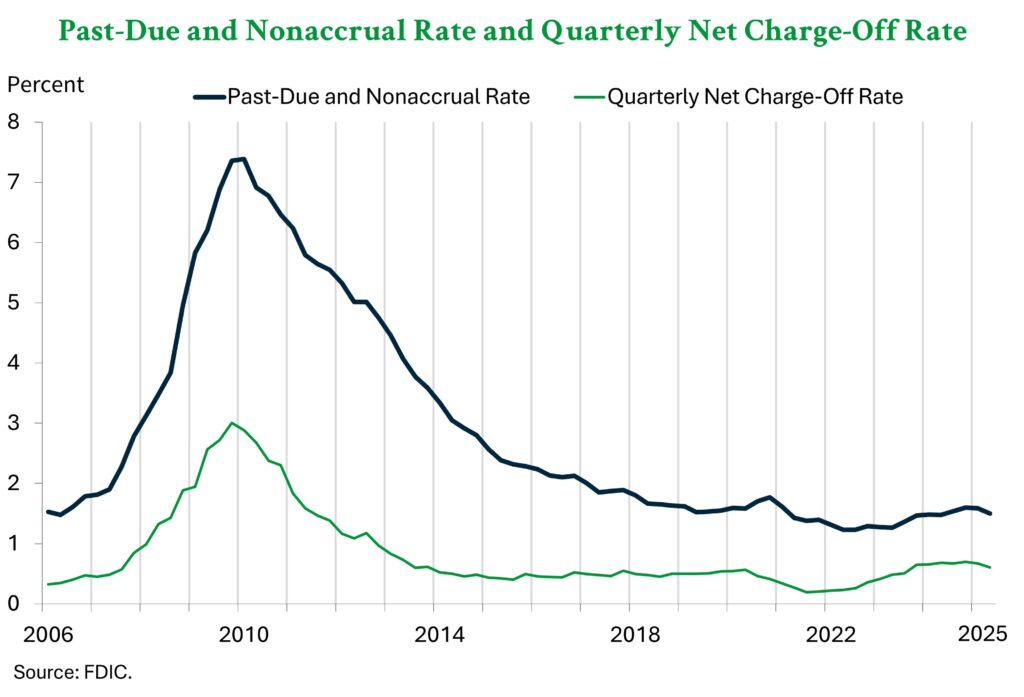
The combined PDNA ratio for all loans declined by 0.09 percentage points for the quarter to 1.50% of total loans, and it remains below the pre-pandemic average of 1.94%. However, within the data, non-owner-occupied commercial real estate [CRE], multifamily CRE, and credit card portfolios have PDNA ratios that exceeded their pre-pandemic averages. This ratio is the proportion of loans that are 30 days or more past due or in nonaccrual status.
The net charge-off ratio also declined in the second quarter to 0.60%. This reading was 0.06 percentage points below the first quarter, and but remained 0.12 percentage points above the pre-pandemic average of 0.48%. This ratio measures the proportion of loans that were deemed uncollectable and moved off a bank’s books.
Total Bank Deposits Continued to Climb in Q2
As the chart below shows, domestic deposits climbed for a fourth consecutive quarter – rising by $101.5 billion, or 0.6%. The total level of bank deposits is a key driver of deposit rates, because it directly influences the level of competition within the industry.
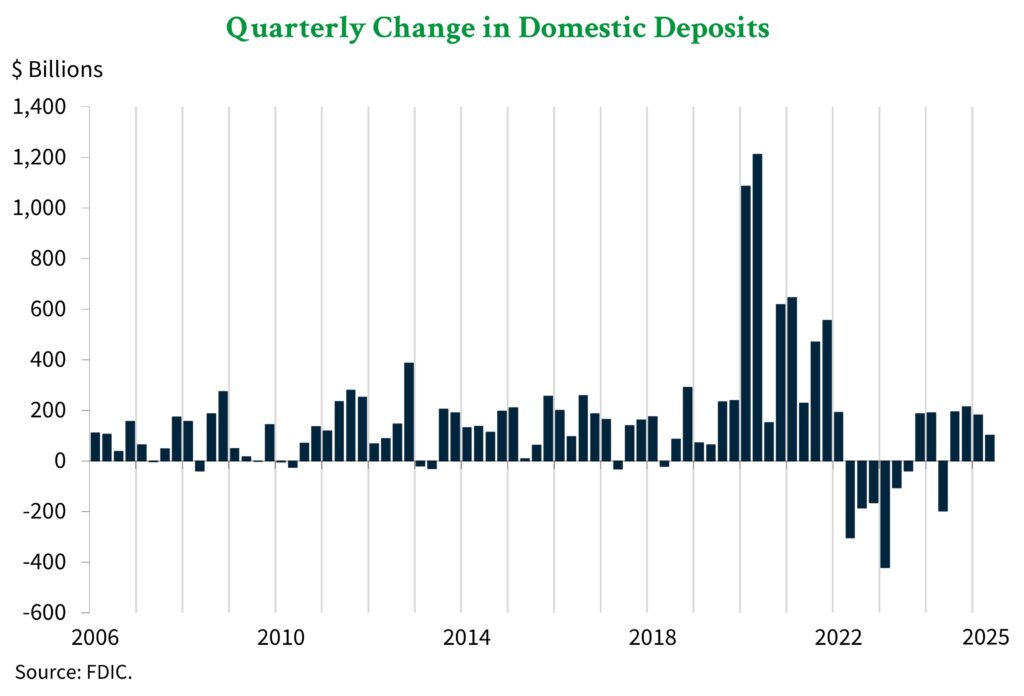
Uninsured deposits – those above the FDIC limit – rose by $186.4 billion, or 2.4%. This growth offset a $87.3 billion (0.8%) decline in insured deposits – those under the limit that are covered by FDIC insurance.
Unrealized Losses on Bank Investment Securities Decreased in Q2
As the chart below shows, unrealized losses on investment securities declined by $17.9 billion, or 4.3%, last quarter. This change was driven by older securities with lower yields continuing to roll off bank balance sheets.
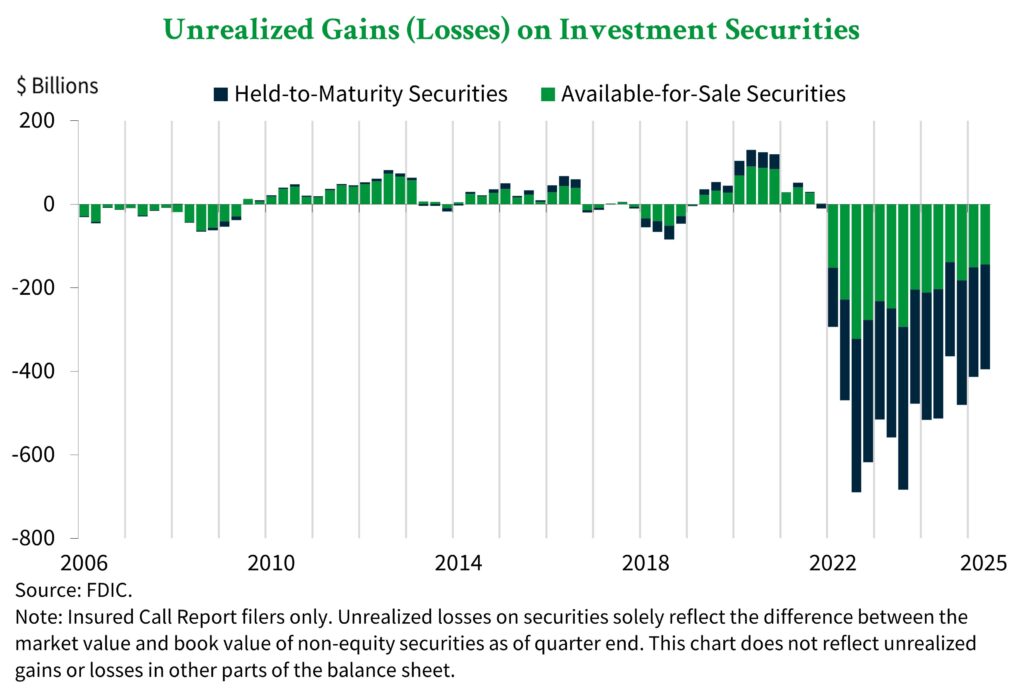
Unrealized losses were an important contributor to the massive bank failures just a few years ago. Banks across the industry reported significant declines in the value of their debt securities as interest rates rose, and some banks were ill-prepared and unable to recover. The decline in reported losses witnessed in the second quarter shows that this risk is shrinking, but it remains a key factor to watch when determining the resilience of banks.
The FDIC Is Well-Prepared to Protect Deposits
The data showed a few key changes that underscore the FDIC’s ability to meet potential banking crises – including more cash in reserve and fewer risky banks. As shown by the chart below, the balance of the Deposit Insurance Fund [DIF] rose by $4.4 billion to $145.3 billion in the second quarter. This fund is the pool of money from which the FDIC would reimburse deposits if needed.
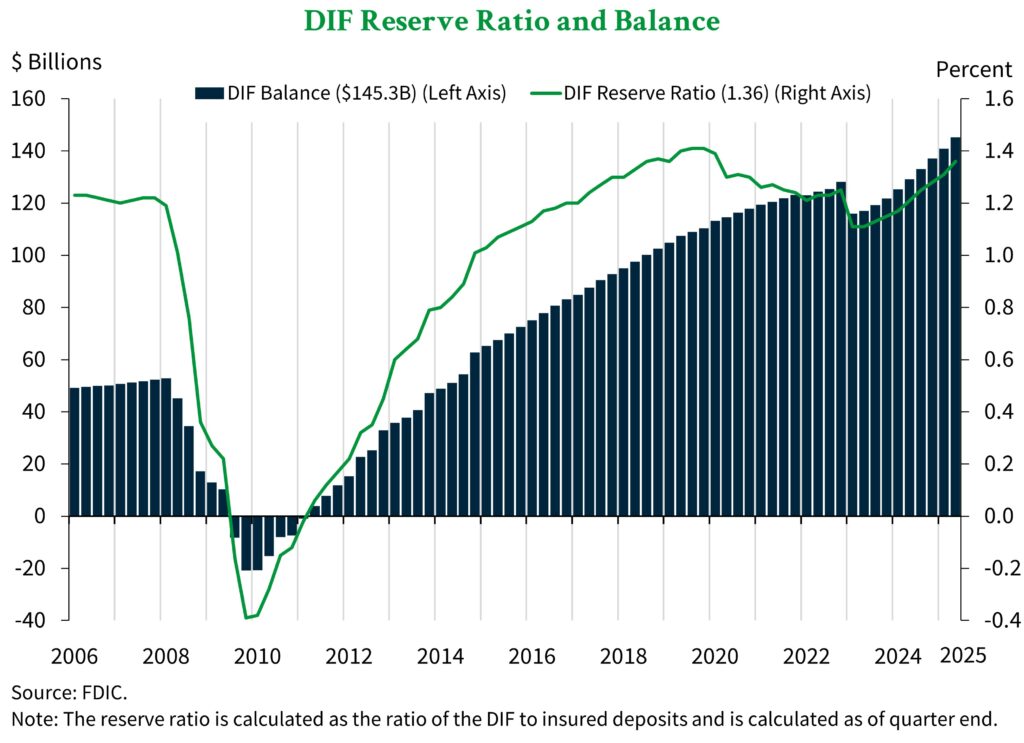
The reserve ratio – which compares the DIF to total insured deposits – rose by 0.5 percentage points to 1.36%. This ratio had declined following bank failures in 2023, and the FDIC was operating under a Restoration Plan to bring the DIF balance back to an appropriate level. The latest increase brought the ratio above the statutory minimum, and the FDIC will no longer be operating under the Restoration Plan beginning in the third quarter.
Further, the total number of “problem banks” declined by a net of 4 to 59 banks in the second quarter, as shown by the chart below. This change brought the percentage of these high-risk institutions to 1.3% – well within the normal range for a non-crisis period.
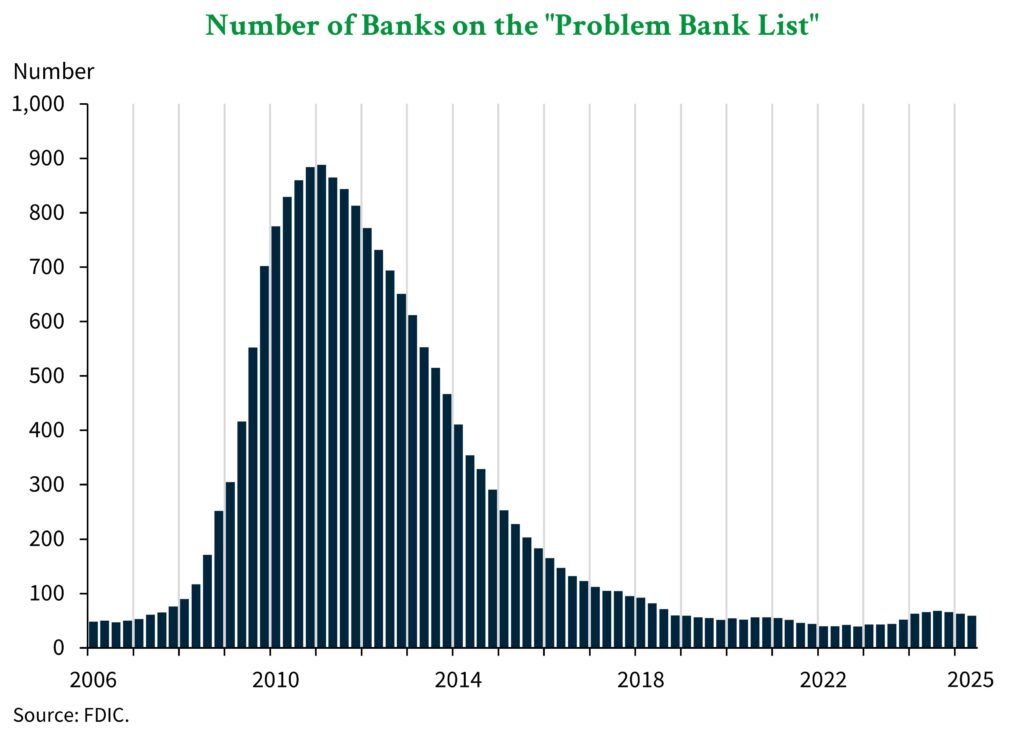
A higher DIF balance and reserve ratio are promising for the FDIC’s ability to respond to any potential crises that may arise. These factors are compounded by the most recent decline in the number of “problem banks.” Altogether, the FDIC’s report shows that the agency continues to be well positioned to protect deposits for American consumers and businesses.
Stay Up to Date with Insights from ADM
At American Deposit Management, we keep our finger on the pulse of changes in the banking industry and publish weekly articles to keep financial leaders informed. Subscribe to our newsletter to have these valuable publications delivered straight to your inbox and view our past articles on the Insights page.
In addition to sharing important information, we help businesses improve the safety of their reserves though a suite of modern cash solutions. These innovative services use patent-pending technology to deliver access to full FDIC / NCUA insurance, nationally competitive returns, and robust liquidity options. Contact a member of our team today to get started.
An Overview of Regulations Governing the Management of Public Funds
Public entities like school districts and municipalities are held to specific regulations that govern the ways funds are invested.
Business Escrow in 2026
Business escrow services are not a new concept, but modern solutions should offer far more than companies could expect in the past.
FOMC Meets in January Amid Continued Inflation and Softening Employment
The FOMC met for the first time in 2026 on January 27th and 28th. At that meeting, they voted to hold the Fed Funds Rate steady.