Q3 Banking Trends: Higher Net Income, Loan Balances, and Deposits
Official economic data has been scarce in recent months due to the government shutdown, leading to challenges for business and banking leaders. Fortunately, the FDIC has continued to monitor the banking industry throughout this period, and they recently released the Quarterly Banking Profile for the third quarter of 2025.
This report is vast, as it covers several major indicators for thousands of banks across the country. To save you time, we summarized the major changes below, so you can stay informed.
Net Income Improved for American Banks
American banks reported a 13.5% increase in net income from the second quarter to the third. As the chart below shows, the improvement brought net income to $79.3 billion, the highest level since the first quarter of 2023.
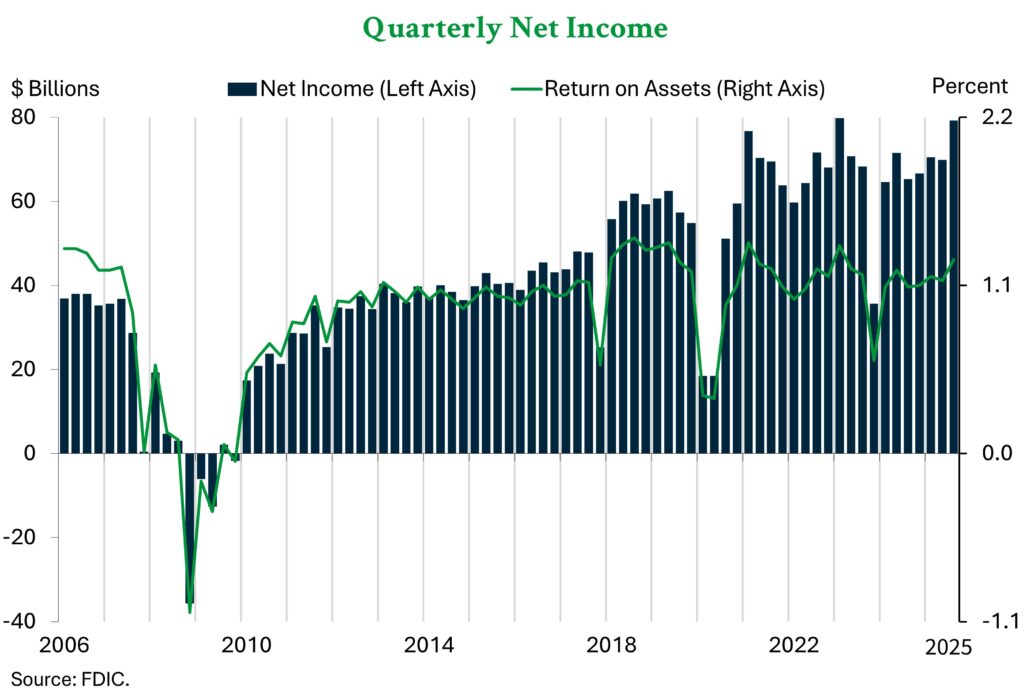
The quarterly improvement in net income was driven by significantly lower provision expenses – down $9.2 billion or 30.7% from the second quarter. This change resulted from an unspecified large acquisition in the second quarter, which significantly increased provision expenses. When disregarding this outlying data point, net income would have still increased for the quarter, due to an increase in net interest income.
Loan Balances Continued to Grow
Total loan and lease balances rose by $159.0 billion (1.2%) to $13.2 trillion for the quarter. The chart below shows that the third quarter marked the sixth consecutive rise in loan balances.
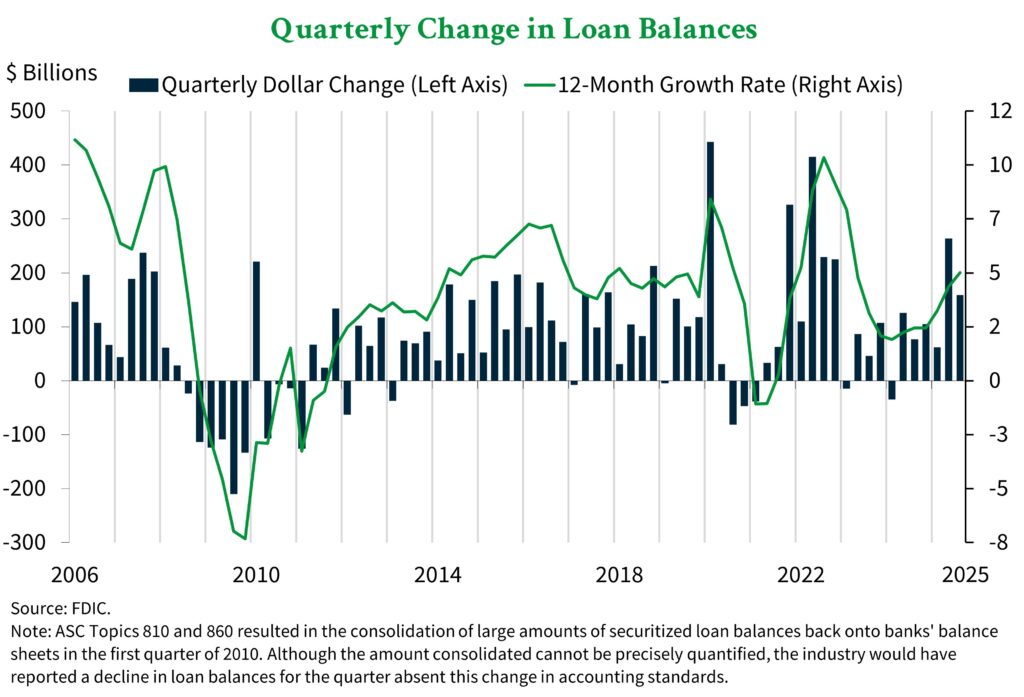
The quarterly increase was driven by loans to non-depository financial institutions, which included reclassifications following reporting changes. Even when excluding reclassifications, consumer and commercial loans grew.
Despite the continued growth in loan portfolios over the year, the loan growth rate was only 4.7%. This rate remains persistently below the pre-pandemic average of 4.9%.
Asset Quality Remained “Generally Favorable”
The percentage of total loans that are 30 or more days past due or in nonaccrual status remained at 1.49% in the third quarter. This rate is known as PDNA, and it is well below the pre-pandemic average of 1.94% as evidenced by the chart below.
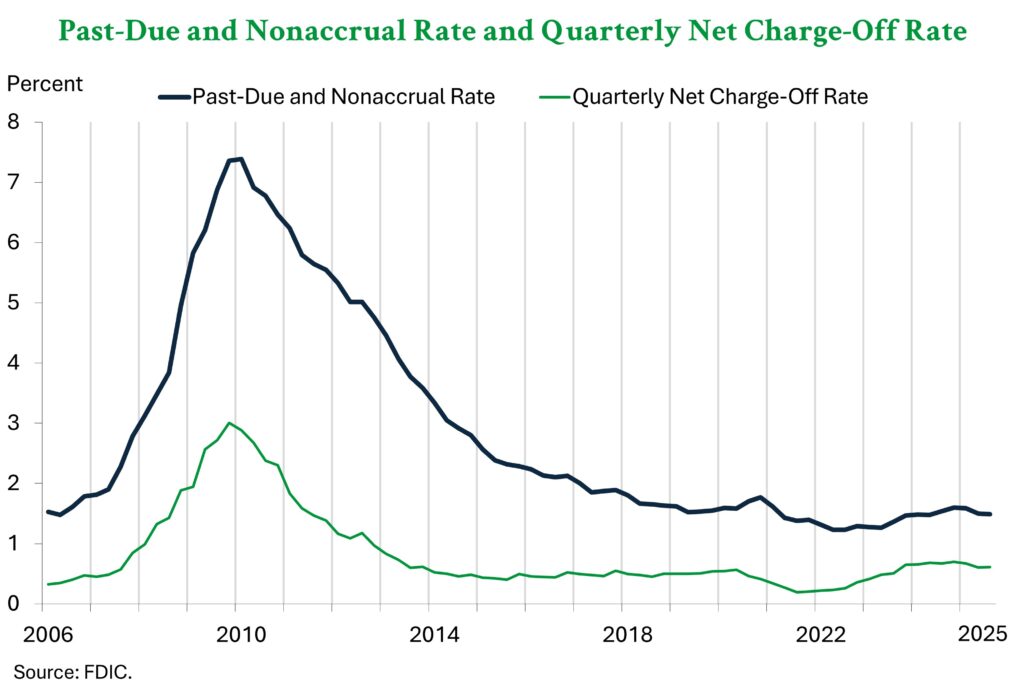
Late payments for non-owner occupied commercial real estate [CRE], multifamily CRE, auto loans, and credit card portfolios remain points of concern. PDNA ratios in these portfolios are well above the pre-pandemic average, particularly for the largest banks.
Despite steadiness in the overall PDNA ratio, the net charge-off rate increased by 0.1 percentage points to 0.61%. This measures the percentage of total loans that are deemed uncollectible, and it is 0.13 percentage points higher than the pre-pandemic average.
Bank Deposits Increased for the 5th Consecutive Quarter
Domestic deposits at FDIC-insured banks increased by $92.2 billion, 0.5%, from the second quarter to the third. The chart below illustrates that this marked the fifth consecutive quarter of growth.
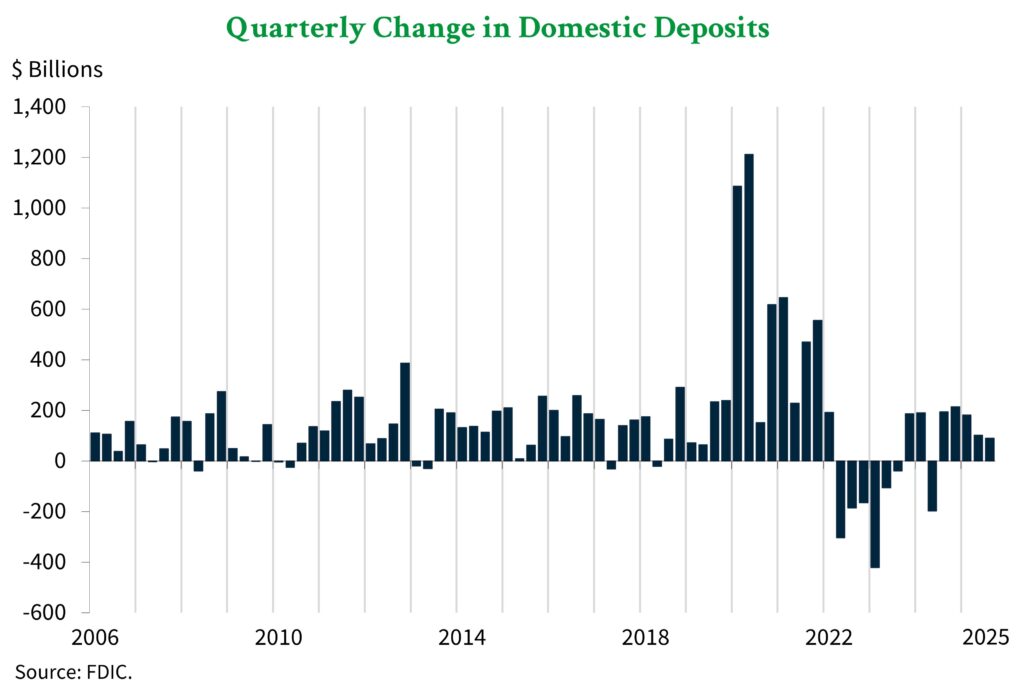
The deposit growth largely reflected higher balances of uninsured deposits – those over the FDIC coverage limit. These deposits are generally considered riskier than insured deposits, and they rose by $88.6 billion or 1.1% for the quarter.
Unrealized Losses on Investment Securities Declined
Unrealized losses on investment securities held by FDIC-member banks declined by $58.2 billion or 14.7% for the quarter. Losses also declined by $26.9 billion, 7.4%, from one year ago, as shown by the chart below.
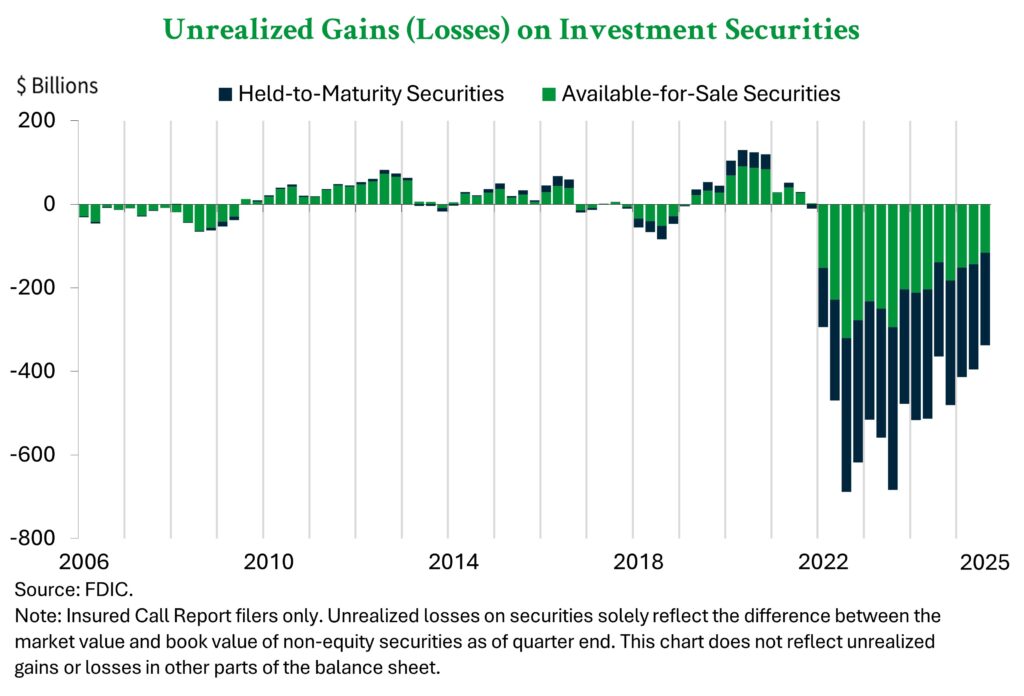
Unrealized losses came under increased scrutiny following the bank failures of 2023 and 2024 because it was theorized that they contributed to the collapse of several notable banks. The securities in question were devalued during a period of rising interest rates, so it stands to reason that an interest rate cut in the third quarter could have contributed to the reduction in unrealized losses for that time frame.
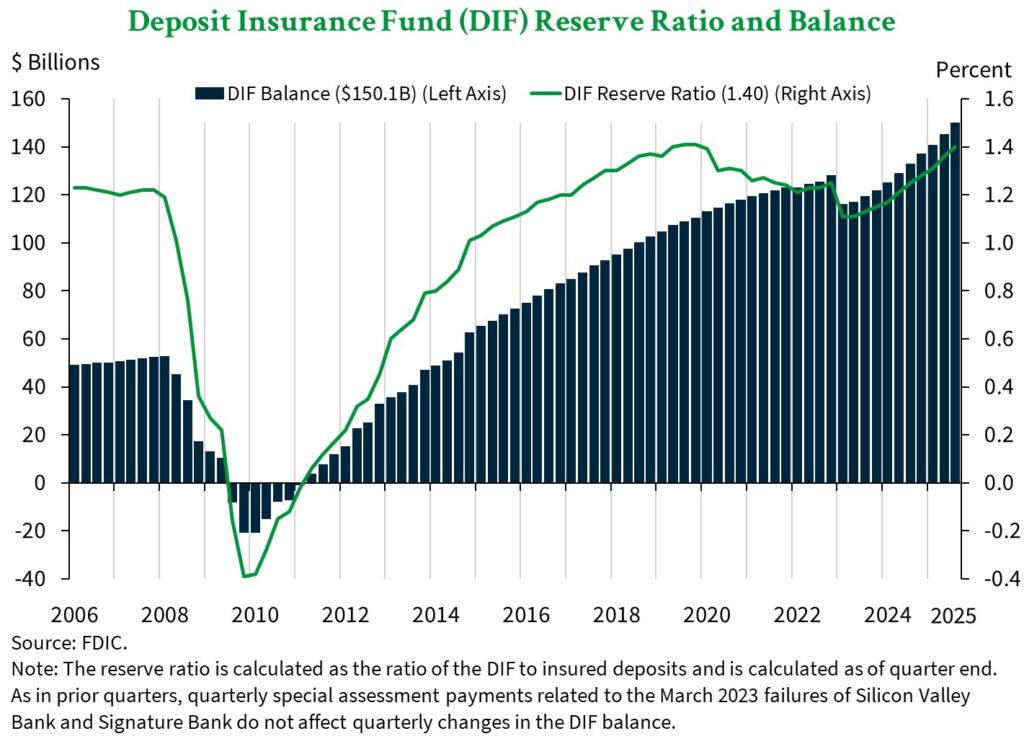
The FDIC Remains Well-Positioned to Respond to Changes in the Banking Industry
Overall, the banking industry posted impressive results in the third quarter. The balance of the Deposit Insurance Fund [DIF] – used to reimburse depositors in the event of a bank failure – grew by $4.8 billion to $150.1 billion. The reserve ratio, which compares the DIF to total insured deposits, also improved by 0.4 percentage points to 1.40%, as shown in the chart below.
The FDIC also has removed 2 financial institutions from the list of Problem Banks. This brings the total number of these banks down to 57, or 1.3% of the 4,379 total banks. The chart below shows how the number of Problem Banks has changed over time.
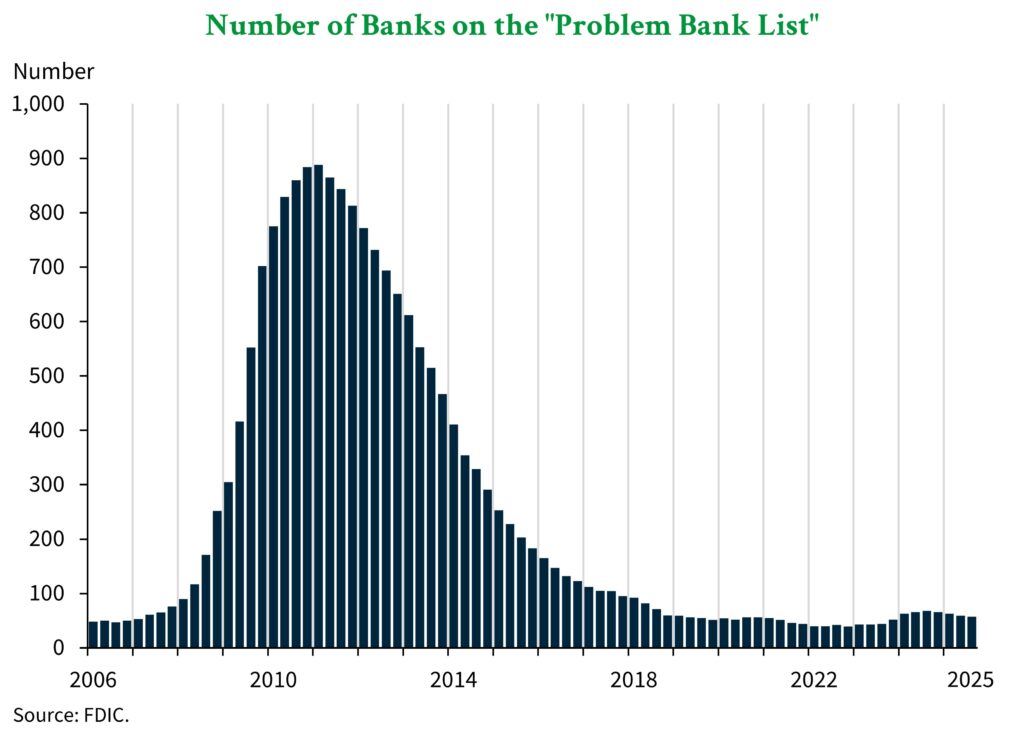
Together, fewer problem banks and a higher DIF balance provide additional confidence that the FDIC is well-positioned to respond to crises. The remainder of the FDIC’s data shows that a near-term crisis is unlikely – barring an incendiary event.
Follow ADM For More Banking Industry Insights
At American Deposit Management, we keep business and banking leaders updated on changes in the banking industry and business cash management practices. Subscribe to our newsletter to have our weekly articles delivered straight to your inbox and view our weekly publications using this link.
We also help businesses manage their reserves through a suite of modern cash solutions. Our patent-pending technology delivers access to full FDIC / NCUA insurance, nationally competitive returns, and robust liquidity options with a single account.
Contact a member of our team today to learn more about our solutions and get started.
Q4 Banking Trends: Strong Net Income, Rising Deposits, Lower Unrealized Losses
American banks reported strong net income and lower unrealized losses alongside higher loan balances and deposit levels in Q4 2025.
How Did the Gramm-Leach-Bliley Act Facilitate Bank Consolidation?
The Gramm-Leach-Bliley Act passed in 1999 and ushered in a new era of consolidated, one-stop shop banking that perseveres today.
An Overview of Regulations Governing the Management of Public Funds
Public entities like school districts and municipalities are held to specific regulations that govern the ways funds are invested.