Understanding the Yield Curve
The yield curve may seem simplistic, but it is actually a powerful tool used by economists, business leaders, and investors to aid in developing their forecasts. The shape of this seemingly simple graph can provide important clues about market sentiment and even predict the future of the economy.
Business leaders in particular need a comprehensive understanding of the yield curve. This knowledge can help them make wise investment choices as well as enhance their economic projections and business decisions.
What Is the Yield Curve?
The yield curve is a graphical representation of a debt investment’s yield relative to its maturity. It is created by plotting maturity along the horizontal axis and yield on the vertical axis.
In financial media, the yield curve most commonly refers to Treasury securities – those issued by the federal government. These investments are backed by the full faith and credit of the U.S. government, so they carry very low default risk. This “risk-free” dynamic makes Treasuries a benchmark for other interest rates in the economy.
The Three Main Yield Curve Shapes
The yield curve changes as frequently as bond yields. It forms three main shapes that signal different investor sentiment and economic outcomes.
Upward Sloping Yield Curve
An upward sloping yield curve forms when short-term bonds have lower yields than long-term bonds. This shape is the most common and is frequently called a “normal” yield curve.
The yield curve is upward sloping under normal economic conditions for several reasons. First, long-term bonds generally have higher risk than short-term bonds. Many factors can change over the course of the investment like interest rates, inflation, and the credit rating of the issuer. Investors expect to be compensated for these risks along with the opportunity cost of forgoing access to their funds for an extended period. These risks become more prevalent as the term of the bond increases, so the yield that investors demand also rises.
Second, investors expect to be compensated for inflation over the course of the investment. Therefore, they demand higher yields for long-term bonds. Additionally, the slope of the yield curve can provide insight into inflation expectations. A yield curve with a steep upward slope generally signals that investors expect higher inflation in the future and are subsequently seeking higher yields to maintain the value of their initial investment.
High inflation often coincides with strong economic growth and rising interest rates. For this reason, an upward sloping yield curve can signal that the economy will perform well in the future and borrowing costs will increase.
Flat Yield Curve
A flat yield curve forms when short- and long-term bonds have roughly equal yields. This dynamic often occurs during periods of economic stagnation or a transition between a normal and an inverted yield curve or vice versa.
The way that business leaders interpret a flat yield curve depends on the previous shape of the curve. When the yield curve flattens after forming an upward slope, this change can signal that the economy is moving from expansion to a slowdown or even a recession. On the other hand, when a flat yield curve forms after a period of inversion, this can be a positive sign that the economy is improving.
Inverted Yield Curve
A yield curve inversion occurs when short-term bonds have higher yields than long-term bonds. It is called “inverted” because the shape of the graph is opposite to normal conditions.
This phenomenon is relatively rare and often occurs when investors expect the Fed to reduce interest rates in the future. Rate cuts typically occur in response to an economic downturn, so an inverted yield curve can be a powerful recession indicator. In fact, a downward sloping – or inverted – yield curve has preceded each recession since the 1970s apart from the brief recession in 2020 caused by the COVID-19 pandemic.
The Yield Curve Today
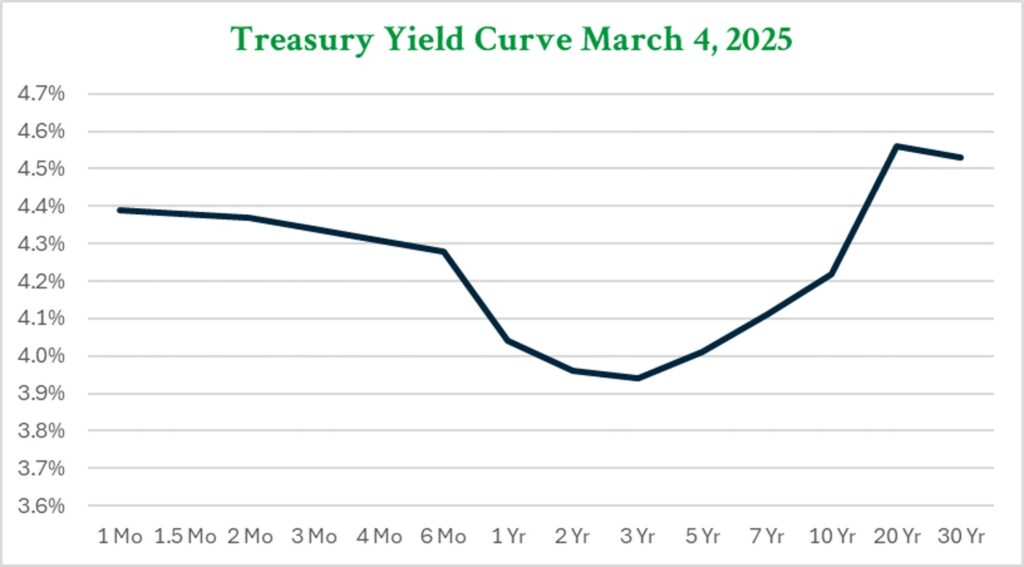
The yield curve was inverted from 2022 through most of 2024. Today, the yield curve forms a slightly upward slope with key short-term yields lower than long-term yields. However, intermediate-term bonds still yield less than short- or long-term alternatives.
The spread between the 10-year Treasury and the 2-year Treasury is a key metric used to understand the shape of the yield curve. On March 4th, the 10-year yield was 4.22% while the 2-year yield was 3.96%. This indicates an upward sloping yield curve and could signal economic growth ahead.
Overall, the yield curve is a powerful economic indicator that can help business leaders craft accurate forecasts and make wise investment decisions. The relationship between short- and long-term bond yields is crucial to cash managers when they balance risk and yield for their company’s cash. By understanding the shape of the yield curve, they can gain a clearer picture of market expectations and adjust their decisions accordingly.
Stay Up to Date on Business and Banking News With ADM
At American Deposit Management, we publish weekly articles that cover important developments in the business and banking industries. You can view our past publications on our Insights page and subscribe to our mailing list to have our articles delivered straight to your inbox. Also, don’t forget to follow us on LinkedIn.
To gain the ultimate safety for cash reserves, contact a member of our team today about our modern cash solutions. We provide access to full government protection from the FDIC or NCUA, nationally competitive interest rates, and a variety of liquidity options.
How to Optimize Excess Corporate Cash in 2026
A CFO’s Guide to Balancing Yield, Liquidity, and Deposit Protection To optimize excess corporate cash in 2026, organizations should segment funds by liquidity need, compare…
How AI Is Transforming Corporate Treasury and Cash Management
AI now forecasts cash, flags fraud, and reconciles accounts in corporate treasury – but adoption remains in early stages.
FOMC June Meeting Summary: Stable Rates, Sweeping Institutional Reforms
The June FOMC meeting marked Kevin Warsh’s first as Chairman, with a rate decision and sweeping reforms to Fed practices.