
Economic downturns can be difficult times, but if businesses anticipate a downturn before it occurs, they can prepare accordingly. Often, business leaders turn to economic indicators to predict what might happen in the economy and use this information to shape their strategy.
An inverted yield curve is one common signal businesses use to make predictions about the economy. This rare phenomenon is often seen as an alarm bell for an impending economic downturn or even a recession. But what is a yield curve inversion and how does it help predict the future of the economy?
What is a yield curve?
To understand what is meant by a yield curve inversion, it’s critical to understand the meaning of “yield curve.” The yield curve is a visual representation of the relationship between the yields of bonds with varying maturities. While any type of bond yields can be compared graphically, the term “yield curve” most often refers to a graph depicting U.S. government bonds, also known as Treasuries.
In a healthy economy, longer-term bonds have higher yields than similar, shorter-term bonds. The main reason for this dynamic is issuers must compensate investors for additional risk associated with locking their money away by holding an investment for a longer term. Over a 10- or even 30-year bond term, much can happen. Interest rates could push bond yields higher and prices lower, inflation could erode the value of the bond, or the credit rating of the issuer could change. These are just some of the risks that investors take when purchasing long-term bonds, and they expect to be compensated for those risks.
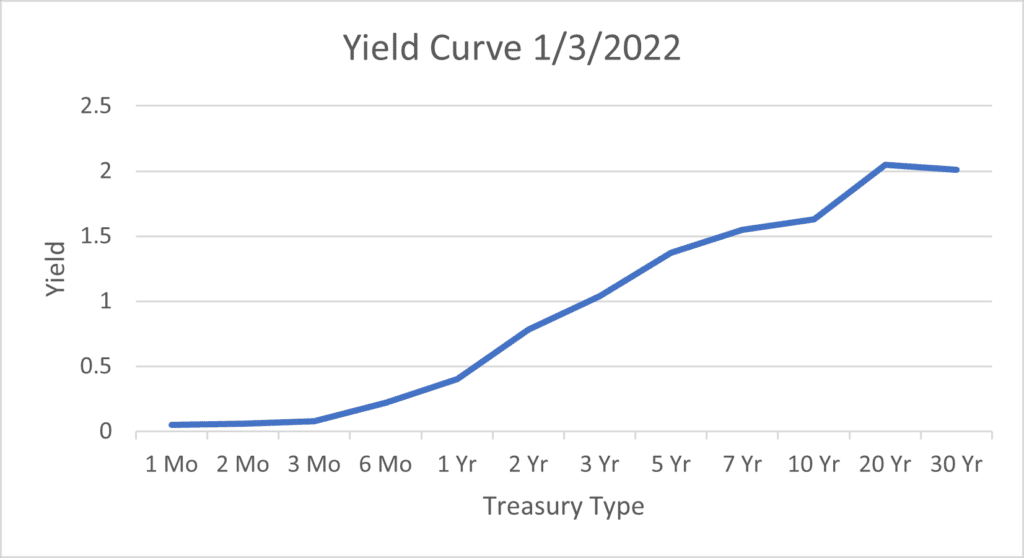
Because longer-term bonds typically have higher yields than shorter-term alternatives, the yield curve usually slopes upward when you plot maturity along the x-axis and yield along the y-axis. The chart below shows the yield curve at the beginning of 2022 when it followed a mostly “normal,” upward sloping pattern. As you can see, with the exception of the 20- and 30-year relationship, the increasing maturity corresponds to a higher yield.
What is a yield curve inversion?
Sometimes, shorter-term bonds have higher yields than longer-term bonds. When this occurs, the yield curve is said to be inverted – as seen for an extended period in the late 1980s and early 1990s. More recently, the yield curve inverted in the summer of 2022, as pictured below.
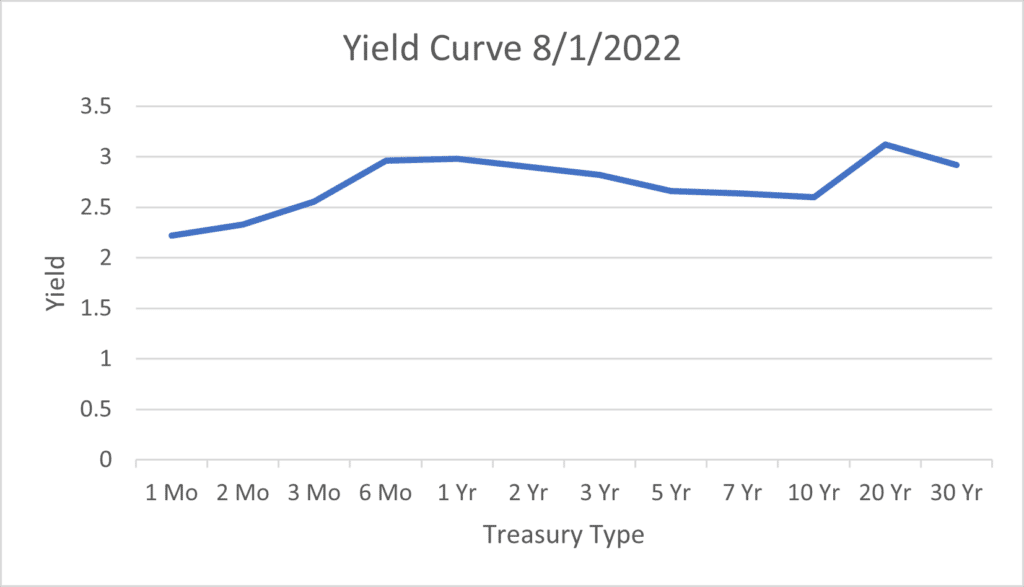
An inverted yield curve may not be as dramatically sloping as a “normal” yield curve. However, key relationships can still be seen – such as the 6-month, 1-year, 2-year, 3-year, 5-year, and 7-year Treasuries yielding more than the 10-year.
What does a yield curve inversion indicate?
An inverted yield curve is rare, and the implications of such an event can be significant. These include investor pessimism and the risk of an imminent recession.
An Inverted Yield Curve Implies Negative Investor Sentiment
An inverted yield curve suggests that investors anticipate a slower economy in the future. If investors anticipate an economic downturn, they also likely anticipate the Fed cutting rates in response. The expectation of lower rates in the future can reduce the yield of long-term bonds and cause the yield curve to invert.
An Inverted Yield Curve Can Signal a Recession but Doesn’t Cause One.
In 1986, economist Campbell Harvey first introduced the concept that an inverted yield curve is an indicator of an impending recession. This theory has since proven to be fairly accurate. In fact, an inverted yield curve has preceded each recession since the 1970s with one exception – the brief recession in 2020 caused by the COVID-19 pandemic.
The chart below demonstrates the cyclical nature of yield curve inversion and recessions. The shaded areas represent past recessions while negative data readings indicate yield curve inversions.
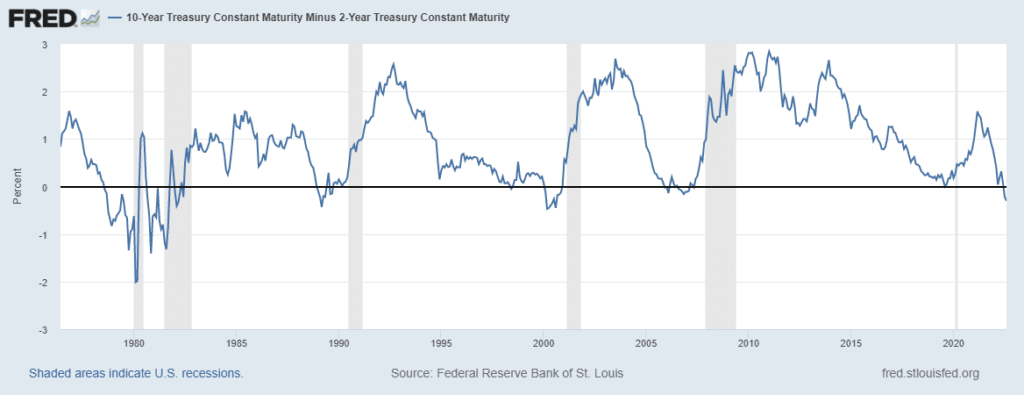
It’s important to note that a yield curve inversion does not accurately predict the timing of a recession. When looking at the relationship between the 10- and 1-year Treasury yields, a recession typically lags a yield curve inversion by 8 to 19 months, with an average of about 13 months. In addition, recessions do not always follow yield curve inversions. For example, in 1965 the yield curve inverted, but a recession did not immediately follow.
What does an inverted yield curve mean for businesses?
Alone, a yield curve inversion may not have a significant impact on most businesses. However, it does mean businesses should prepare for decreased demand for their offerings and tighter credit markets that could be on the way.
One way that businesses can prepare for an economic downturn is by increasing cash reserves. During tumultuous times, additional cash can help insulate organizations from the negative impacts of a recession. If a recession materializes, businesses can rely on their cash reserves to supplement lost revenue. This tactic can reduce reliance on new credit and provide cash to meet cashflow shortfalls – if sales take a hit.
Prepare for A Recession with AMMA™ By ADM
A yield curve inversion could indicate economic turmoil on the horizon. In uncertain times, businesses must ensure that their cash reserves are safe and earning a competitive return. FDIC / NCUA insurance provide the most robust protection against bank failure, but this coverage is limited. Fortunately, our company, the American Deposit Management Co. [ADM], has solved this problem using our proprietary fintech.
With our American Money Market Account™ [AMMA™] businesses can receive access to extended FDIC / NCUA protection for all their funds along with nationally competitive interest rates, next-day liquidity, and a single consolidated monthly statement. That’s why businesses who carry large cash reserves turn to ADM. Our team is our secret sauce, and we look forward to streamlining your cash management program.
To learn more about ADM and our suite of cash management services, contact us today.
*American Deposit Management Co. is not an FDIC/NCUA-insured institution. FDIC/NCUA deposit coverage only protects against the failure of an FDIC/NCUA-insured depository institution.